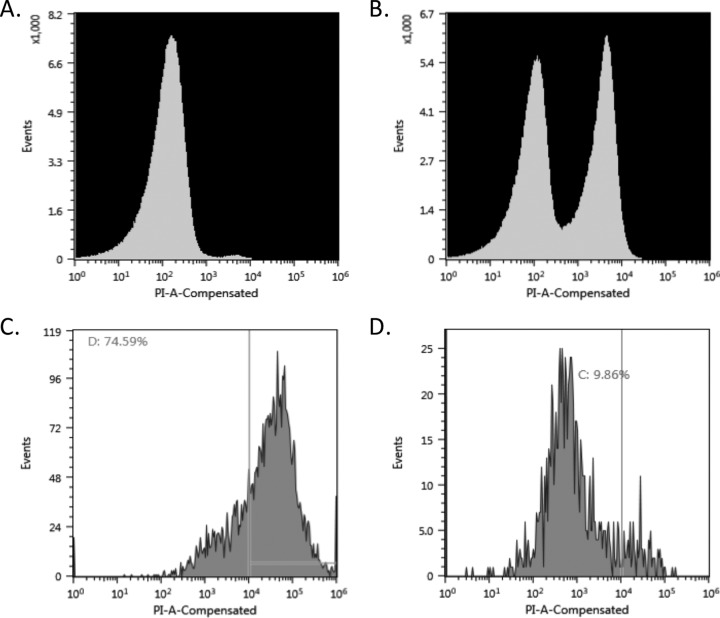
FIG 3.
Flow cytometric analysis of prey cell killing by CA052B OMVs and supernatant. (A) Live P. mirabilis cells. (B) P. mirabilis cells treated with ethanol to produce a mixture of live and dead cells. (C) Live P. mirabilis cells treated with CA052B OMVs. (D) Live P. mirabilis cells treated with CA052B supernatant. Percentages of events exceeding the propidium iodide fluorescence intensity (PI-A-Compensated) thresholds, shown as vertical lines, are presented in panels C and D.

