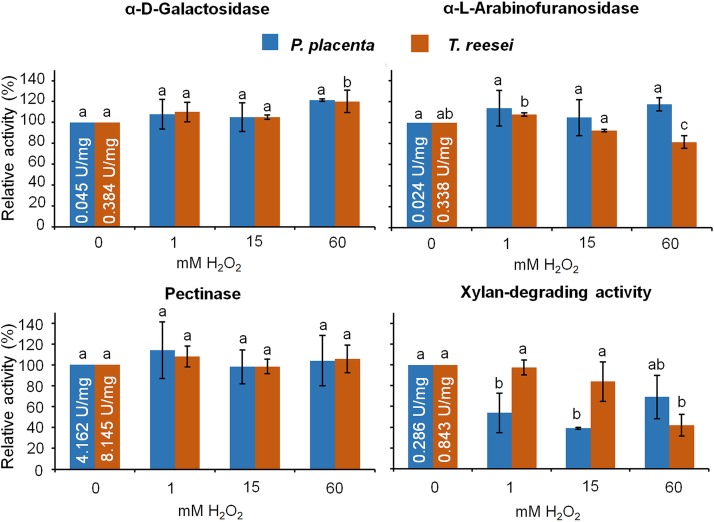
FIG 4.
Treatment controls using only H2O2. Damage of GH activities susceptible to the Fenton reaction was assessed for some of the H2O2 concentrations used in the Fenton treatment (1, 15, and 60 mM). The values are shown as activities of treated samples (1, 15, and 60 mM H2O2) relative to untreated samples (0 mM H2O2) (means ± standard deviations; n = 3). Bars with the same lowercase letters in the same series are not significantly different (P > 0.05). Initial specific enzyme activities are embedded as units per milligram within the controls.

