FIG 3.
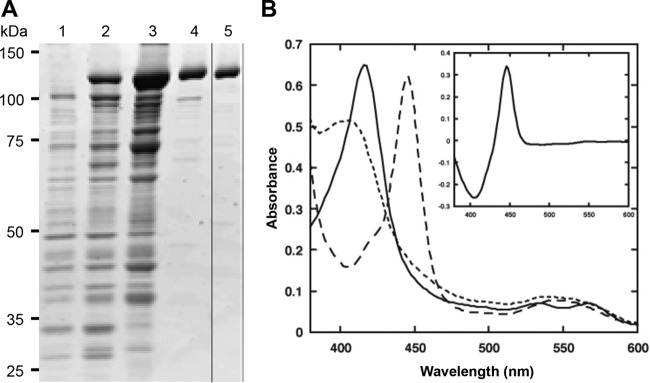
SDS-PAGE analysis and absorption spectra of recombinant CYP505D6. (A) SDS-PAGE analysis of purified CYP505D6. The expression of CYP505D6 was induced by the addition of arabinose (final concentration of 0.2%, wt/vol), and the culture was allowed to continue for up to 48 h at 30°C. Protein profiles before induction (time zero) (lane 1) and after a 48-h induction (lane 2) are shown. The crude extract was loaded onto a DEAE-Sepharose column. The protein fraction was continuously eluted off the DEAE-Sepharose column (lane 3) and the 2′,5′-ADP-Sepharose column (lane 4), followed by gel filtration chromatography (lane 5) and analysis of the eluates. (B) Absorption spectra of CYP505D6. Solid line, resting (oxidized); dotted line, dithionite reduced; dashed line, dithionite reduced plus CO; inset, CO difference spectrum (CO bound minus dithionite reduced).

