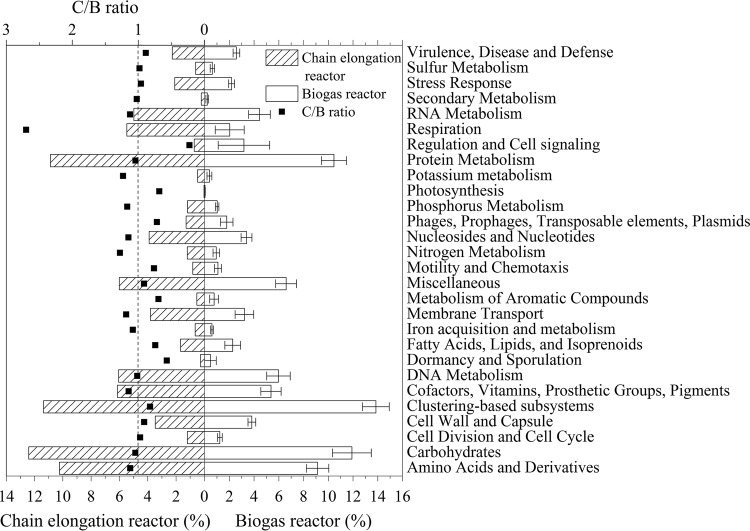
FIG 4.
Distribution of the functional genes obtained in the present study and in biogas reactor microbiome as determined with Subsystems. ■, the ratio of relative abundances of functional genes between chain elongation microbiome and biogas reactor microbiome based on metagenomic data (C/B ratio). The data for the biogas reactor are averages from 17 biogas reactors, and the error bars indicate the standard deviations.

