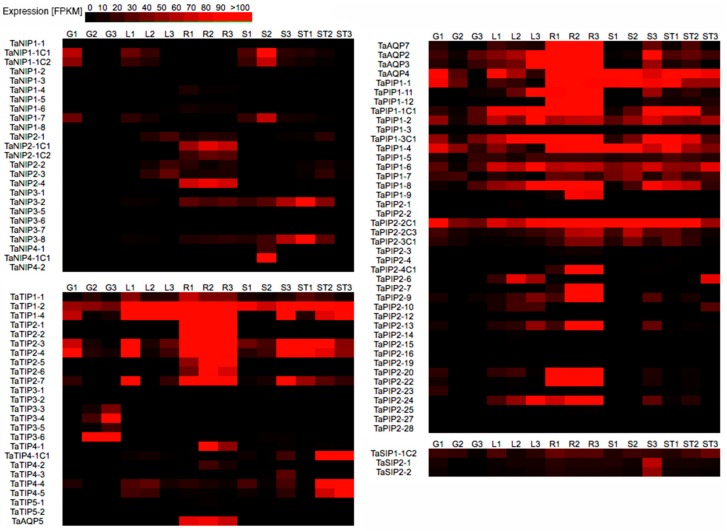
Figure 5.
Analysis of AQP expression in different organs and developmental stages of wheat. Each heatmap corresponds to a subfamily of AQP. The intensity of the red color indicates the level of up-regulation of the gene in FPKM values. Development stages are indicated according to Zadoks scale: G1: Grain_Z71; G2: Grain_Z75; G3: Grain_Z85; L1: Leaf_Z10; L2: Leaf_Z23; L3: Leaf_Z71; R1: Root_Z10; R2: Root_Z13; R3: Root_Z39; S1: Spike_Z32; S2: Spike_Z39; S3: Spike_Z65; ST1: Stem_Z30; ST2: Stem_Z32; ST3: Stem_Z65. Microarray data were obtained from [62].

