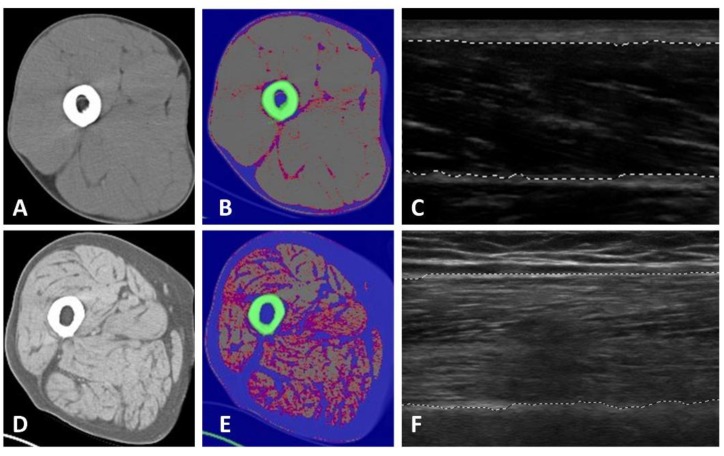
Figure 1.
Exemplar ultrasound images of the rectus femoris and axial computed tomography CT images of the mid-thigh in two study participants. Mean grayscale measures of echogenicity at the rectus femoris of the dominant leg were derived from longitudinal ultrasound images and axial CT scans were obtained from the same anatomical plane at the mid-thigh. The images featured in Panel (A–C) depict a study participant with 15% cross-sectional fat mass and 7% intra- and intermuscular adipose tissue (IMAT). In contrast, the images in Panel (D–F) show a study participant with 66% cross-sectional fat mass and 40% IMAT (Hounsfield units: −190 to −30 for adipose tissue, 0 to +30 for low density muscle, and +31 to +100 for normal density muscle tissue).

