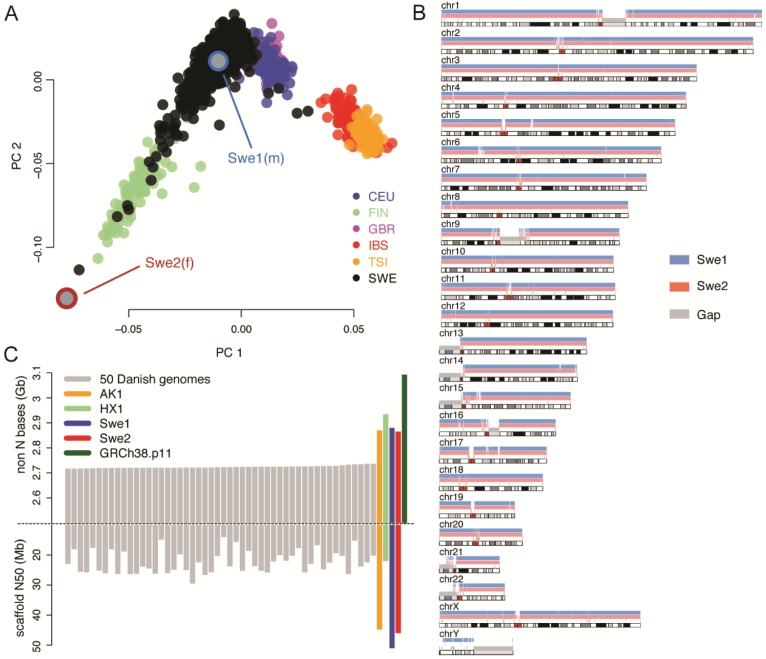
Figure 1.
Selection of individuals and de novo assembly results. (A) Results of principal component analysis (PCA) of whole genome sequencing (WGS) data from the SweGen project [1], compared to the European 1000 Genomes data [27] (CEU: Utah Residents with Northern and Western Ancestry, FIN: Finnish in Finland, GBR: British in England and Scotland, IBS: Iberian Population in Spain, TSI: Toscani in Italia). The black dots indicate 942 samples from the Swedish Twin Registry (STR), which were sequenced within the SweGen project and represent a cross-section of the Swedish population. Swe1 and Swe2 are the individuals selected for de novo sequencing. (B) Alignment of contigs for Swe1 (blue) and Swe2 (red) to the human GRCh38 reference. A total of 6812 contigs could be aligned for Swe1 and 6924 for Swe2. Only the male Swe1 sample has extensive coverage of the Y chromosome. (C) The bars show the total number of non-N bases (top) and scaffold N50 values (bottom) for Swe1, Swe2, and a selection of other human de novo assemblies. The grey bars represent the top 50 genomes with the highest number of non-N bases from an Illumina mate-pair assembly of 150 individuals [10]. The Korean (AK1) and Chinese (HX1) genomes were assembled by a combination of single-molecule real-time (SMRT) sequencing and optical mapping. Scaffold N50 is not shown for GRCh38 (in green) since it is much higher than for the personal genomes and difficult to fit into the same plot.

