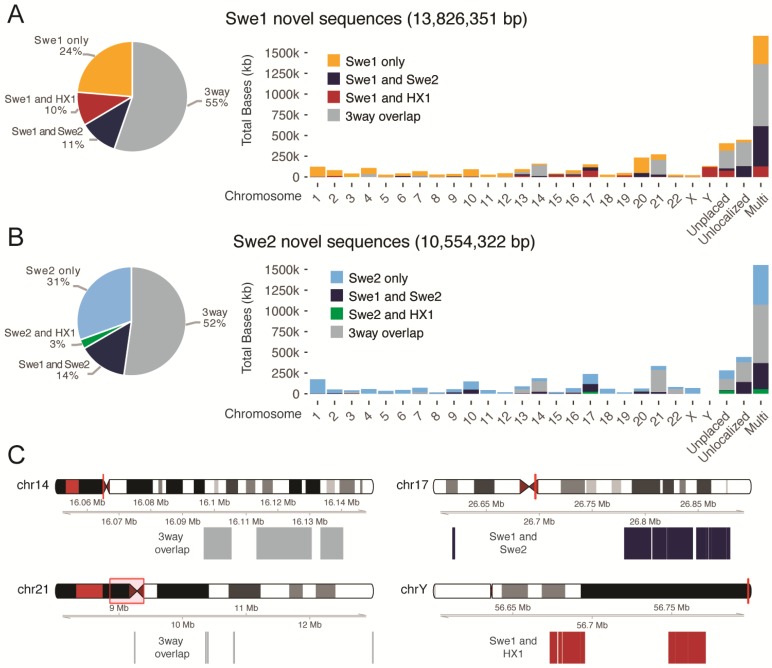
Figure 3.
Anchoring of Swe1 and Swe2 NS to the hg38 reference. (A) The pie chart to the left shows the proportion of Swe1 NS (in total 13.8 Mb) that are also found in Swe2 or in the Chinese HX1. The category 3way (grey) represents NS that are found in all three individuals. The bars to the right show the amount of NS that can be anchored to the hg38 genome. The category unplaced represents sequences in hg38 that are not associated with any chromosome, and unlocalized corresponds to sequences that are associated with a specific chromosome but have not been assigned an orientation and position. The multi category furthest to the right represents NS that are mapping to multiple chromosomes. (B) Similar results for NS detected in Swe2. (C) Examples of chromosomal regions where a high amount of NS are detected. The two plots to the left show the localization of 3way overlap sequences (i.e., found in Swe1, Swe2, and HX1) near the centromeric regions of chr14 and chr21. The top right panel displays a region on chr17 where an excess of NS found only in Swe1 and Swe2 could be anchored. The bottom left panel shows NS detected only in the two males (Swe1 and HX1) that could be anchored to regions close to the telomere of chromosome Y.

