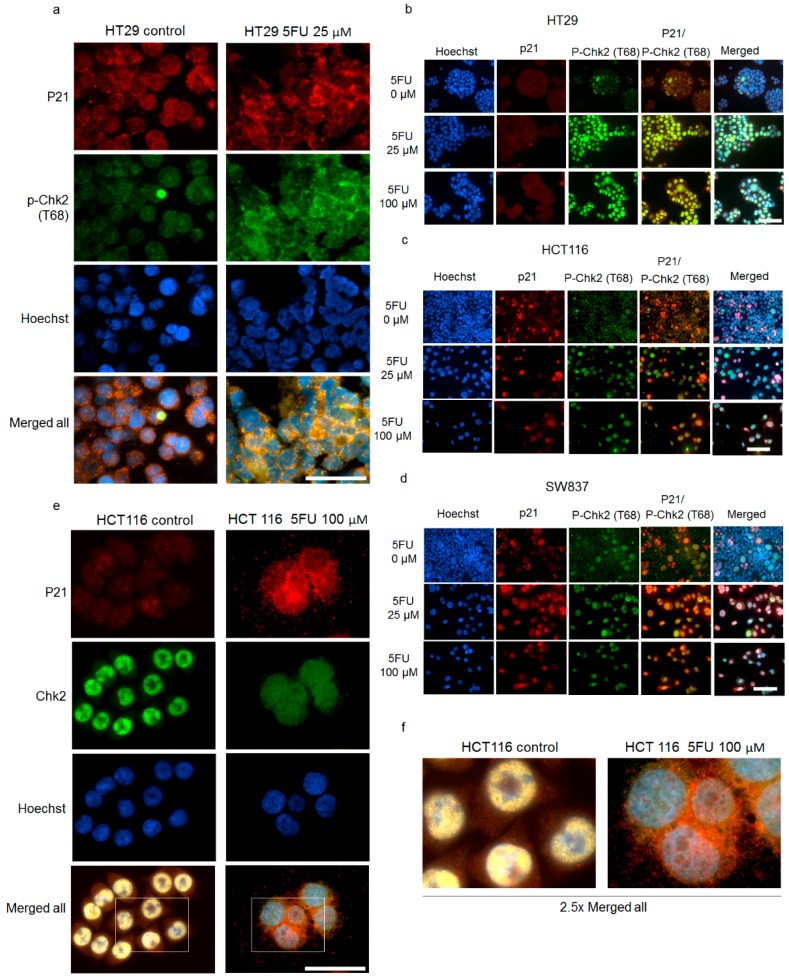
Figure 6.
Co-localization of p21 and p-Chk2T68/Chk2 in 5FU-resistant cells. (a,b) HT29, (c) HCT116 and (d) SW837 cells were treated with various concentrations of 5FU for 48 h and the expression of p21 and p-Chk2T68 was examined by immunofluorescence staining using mouse anti-p21 monoclonal antibodies followed by an Alexa Fluor 555-labeled secondary antibody to visualize p21 expression (red), rabbit anti-p-Chk2T68 monoclonal antibodies followed by an Alexa Fluor 488-labeled secondary antibody to visualize p-Chk2T68 expression (green) and cell nuclei (Hoechst 33342, blue). (a) Enlarged images of p21 and p-Chk2T68 co-localization in 5FU-resistant HT29 cells. Scale bar: 50 μm; (e) HCT116 cells were treated with 100 μM 5FU for 48 h and the expression of p21 and Chk2 was examined by immunofluorescence staining using mouse anti-p21 monoclonal antibodies followed by an Alexa Fluor 555-labeled secondary antibody to visualize p21 expression (red), rabbit anti-Chk2 monoclonal antibodies followed by an Alexa Fluor 488-labeled secondary antibody to visualize Chk2 expression (green) and cell nuclei (Hoechst 33342, blue). Scale bar: 50 μm; and (f) 2.5-fold computer-enlarged images from merge images in (e).

