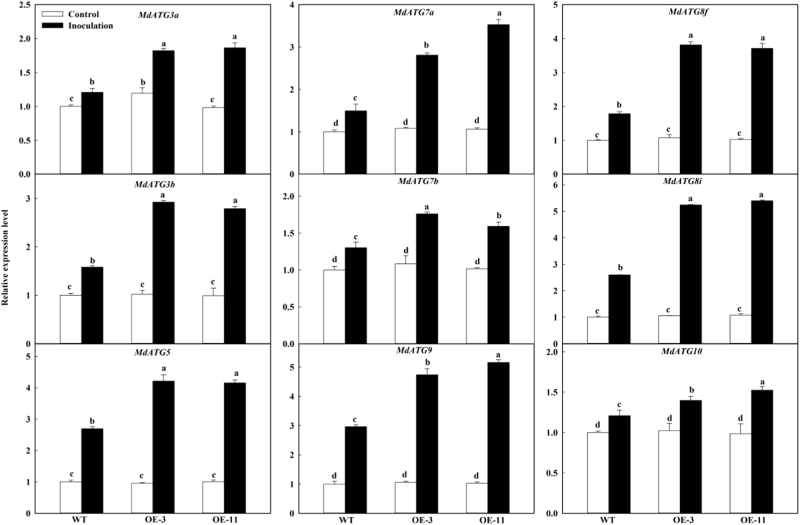
Fig. 6. Changes in transcription level of apple autophagy-related genes under infection.
Total RNA was isolated after 6 dpi, and expression levels were calculated relative to the expression of Malus EF-1α mRNA. Expression in WT under control conditions was set to “1”. Data are means of three replicates with SD. Experimental data were presented as means ± SD. Different letters indicate significant differences between treatments, according to one-way ANOVA Tukey’s multiple range tests (P < 0.05)

