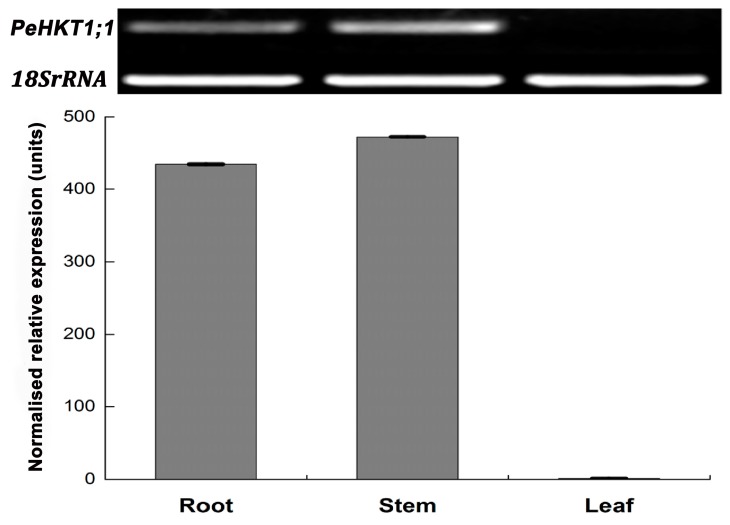
Figure 2.
Tissue-specific expression levels of PeHKT1;1 analyzed by SqRT-PCR and qRT-PCR in “Nanlin895” poplar. The Y-axis represents relative quantitation and X-axis represents different tissues. The 18SrRNA gene was used as an internal control for SqRT-PCR, the EF1α gene was used as a control for qRT-PCR, and the relative transcript levels were calculated using the 2−ΔΔCt method. Error bars showed standard deviations of three biological replicates.

