Fig. 2.
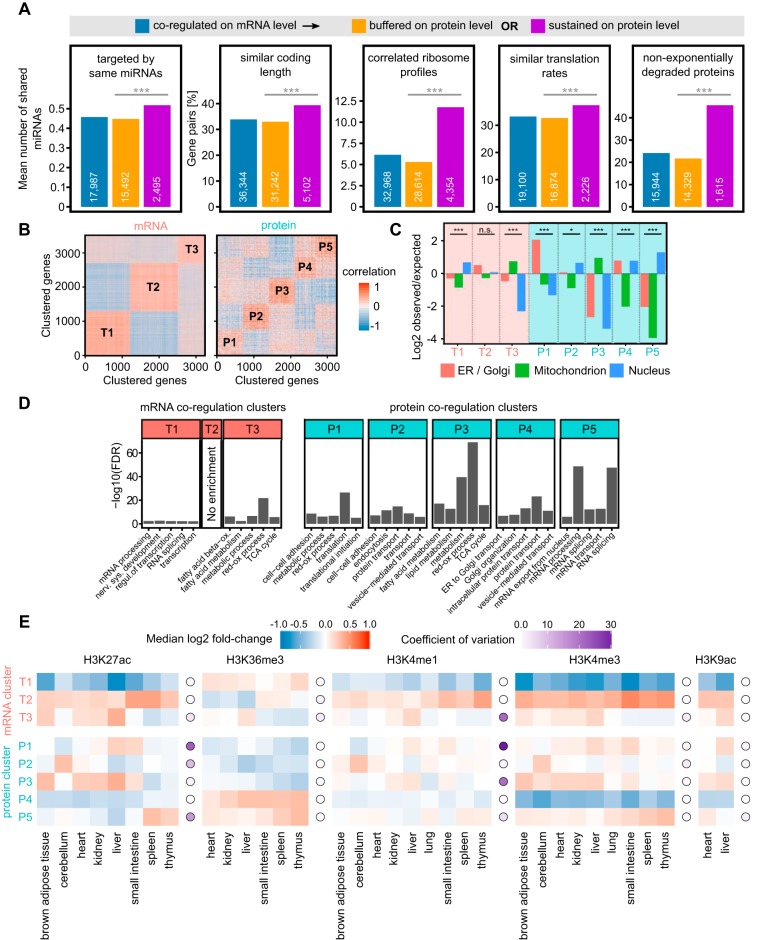
mRNA and protein coregulation clusters are functionally distinct and display different epigenetic signatures. A, Analysis of post-transcriptional regulation of gene pairs coexpressed on mRNA level. Gene pairs with sustained coexpression on the protein level share on average more miRNA targeting than pairs with buffered coexpression on the protein level (Mann Whitney p value < 0.0001). Gene pairs were considered to have similar CDS length if the ratio of the longer sequence to the shorter was < 1.5. Gene pairs were considered to have correlated ribosome profiles if their ribosome occupancy profiles had Pearson correlation coefficient > 0.5 (Holm adj. p value < 0.001). Gene pairs were considered to have similar translation rates if the absolute log2 ratio of their translation rates was lower or equal 1. For the non-exponentially degraded proteins (NEDs) bar chart, gene pairs containing at least one NED were counted. B, K-means clustering of the mRNA and protein coexpression data. Three distinct mRNA clusters and five distinct proteins clusters explained ∼50% of the variance in the respective data. C, mRNA coregulations clusters (T1–T3) have lower protein subcellular localization enrichments than protein coregulation clusters (P1–P5). The significance of enrichments/depletions in each cluster was tested using Pearson's Chi-squared test. ***p value < 0.0001, *p value < 0.05, n.s. = not significant. D, GO enrichment analysis of the genes in the mRNA and protein coregulation clusters. More GO terms are enriched in protein than in mRNA clusters. E, mRNA-based clusters T1 and T2 have uniform epigenetic signal distributions displaying little between-tissue variability as opposed to protein clusters which show large between-tissue and between-cluster variability. Epigenetic signal enrichment in tissue (squares), coefficient of variation for each histone mark (circle), color code as shown.

