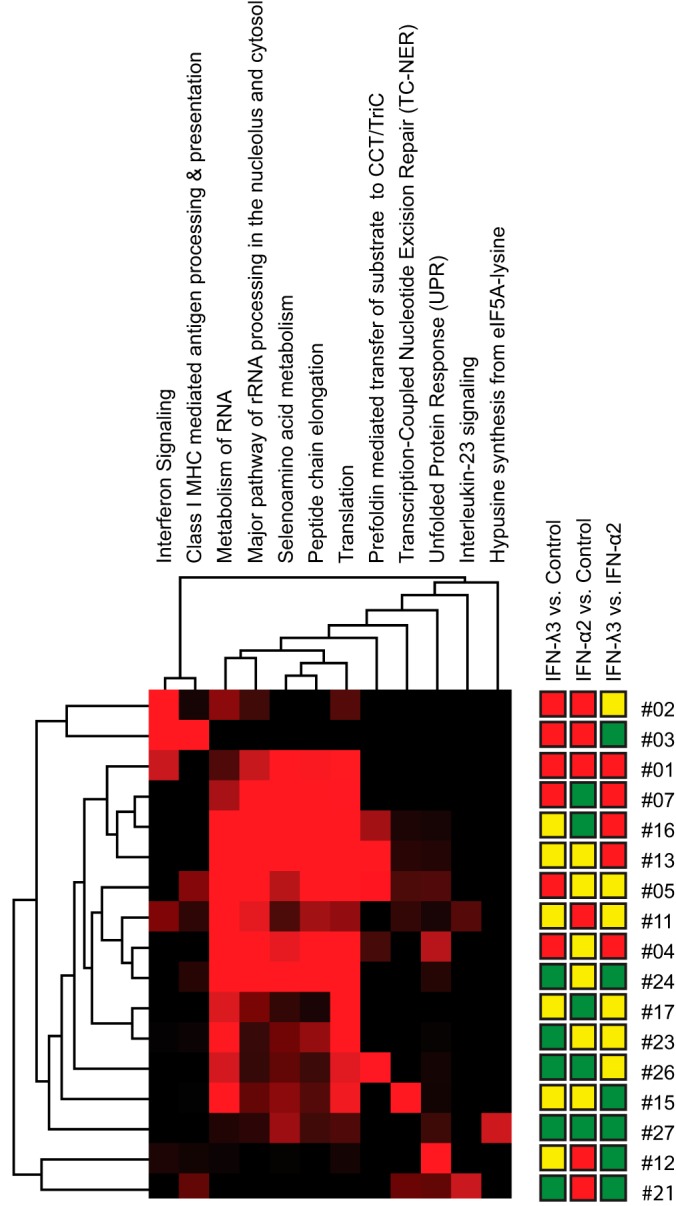
Fig. 13.

Enrichment heatmap. Reactome enrichment analysis was performed on the tree outcomes that contained at least 9 members, excluding outcome #14 in which no significant alterations were seen on any treatment. Probabilities (Reactome's hypergeometric test, -log(p value)) were generated for every intersection of these tree outcomes with the specified Reactome groups. This matrix of probabilities was then submitted for two-dimensional cluster analysis using Cluster 3.0 and Java Treeview. The result is displayed as a heatmap. Red color intensity indicates the level of significance.
