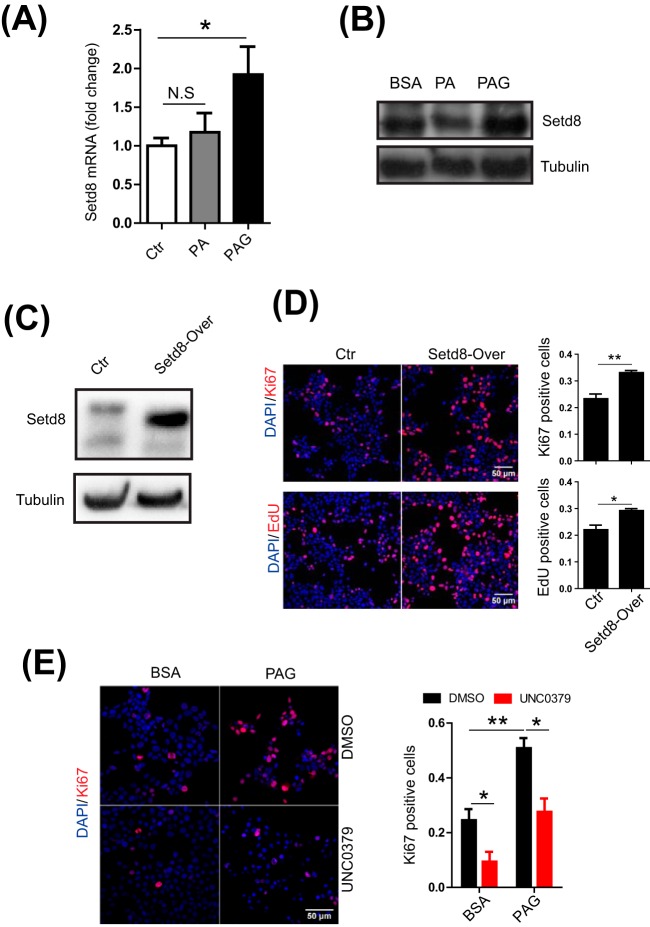
Fig. 4.
A, Quantitative RT-PCR analysis of Setd8 in INS-1 cells treated with BSA, PA and PAG for 24 h. B, Immunoblotting of Setd8 in INS-1 cells treated with BSA, PA and PAG for 24 h. C, Immunoblotting of Setd8 in the control (Ctr) and Setd8-overexpressed INS-1 cells. D, Immunofluorescence images of Ctr and Setd8-overexpressed INS-1 cells. The replicating INS-1 cells were recognized as Ki67+ (up) and EdU+ (down) cells. E, Immunofluorescence images of INS-1 cells treated with PAG and Setd8 specific inhibitor (UNC0379) for 48 h. The replicating INS-1 cells were recognized as Ki67+ cells. All results shown are the mean ± S.E. from three independent experiments. Statistical analysis was performed with two-tailed Student's t test. *p < 0.05; **p < 0.01.

