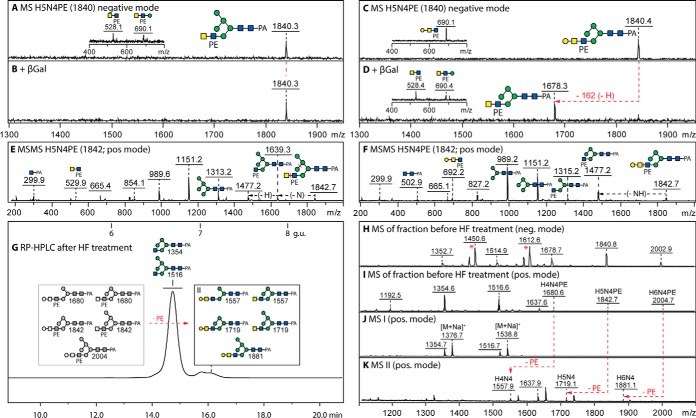
Fig. 4.
MALDI-TOF MS analysis of phosphoethanolamine-modified N-glycans. A–F, Analysis of two 2D-HPLC separated glycans of m/z 1840/1842 (Hex5HexNAc4PE1; for the HIAX chromatogram, see supplemental Fig. S8) showing negative mode spectra before and after treatment with β1,3-specific galactosidase (β3Gal), which (together with the effects of HEX-4 β-N-acetylgalactosaminidase and jack bean α-mannosidase; see supplemental Fig. S9A–S9N) aid definition of the isomeric positions for mannose or galactose; insets show a region of the negative mode MS/MS spectrum highlighting changes in the phosphoethanolamine-containing B-fragments. G–K, RP-amide HPLC and MALDI-TOF MS of the 6.6–6.8 g.u. fraction after hydrofluoric acid treatment showing the shift to later elution times on loss of phosphoethanolamine of a small proportion (10%) of glycans in this particular fraction (peak II with smaller m/z), whereas the elution position of the major m/z 1354/1516 glycans (peak I) remains unaffected; the phosphoethanolamine-modified glycans are observable in negative and positive modes, whereas the simple hybrid structures are also detected as adducts in negative mode (indicated as *). Alterations in MS because of digestion are indicated with red arrows; greyscale annotations in panel G indicate original structures before removal of phosphodiesters. For further MS/MS data, refer to supplemental Figs. S8 and S9.

