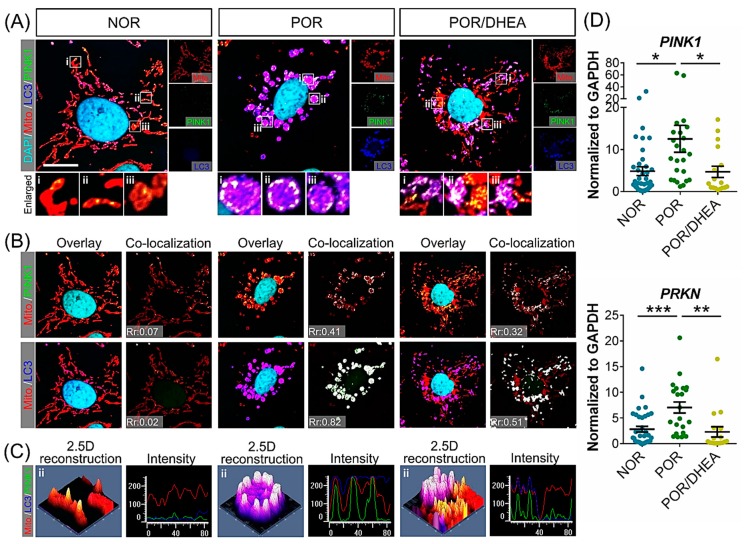
Figure 6.
DHEA supplementation decreased mitophagy of cumulus cells (CCs) in poor ovarian responders. (A) Confocal images of CCs loaded with MitoTracker, LC3, PINK1, and DAPI. The enlarged images in (B,C) highlight the representative co-localization with 30× magnification from white squares in the overlay images. (B) Co-localization analyses of Mito/PINK1 and Mito/LC3. The co-localization in (B) is presented as the product of the differences from the mean (PDM) image. White color pixels indicate co-localization coefficient. (C) A 2.5-dimensional reconstruction and fluorescence intensity of the respective insets in (A) compared between green, red, and blue fluorescence. Data represented the mean ± SEM of 3–5 independent experiments. (D) qRT-PCR analysis for relative mRNA levels of mitophagy genes of CCs (n = 19–28). i-iii: enlarged insets * p < 0.05, ** p < 0.01, *** p < 0.001. Scale bar: 20 μm.

