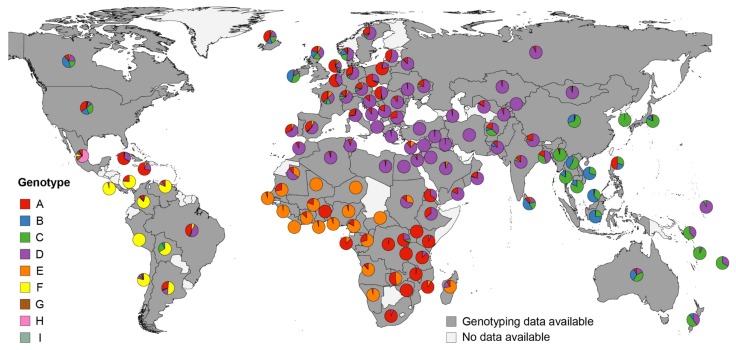
Figure 3.
Distribution of HBV genotypes by country. Pie charts indicate proportional HBV genotype distributions in the respective countries. Genotype distributions within samples with successful genotyping are presented, excluding inter-genotype recombinant viruses, co-infections with more than one HBV genotype or undefined infections. Underlying literature sources and number of sequenced isolates are given in Table S1 (Supplementary Materials).

