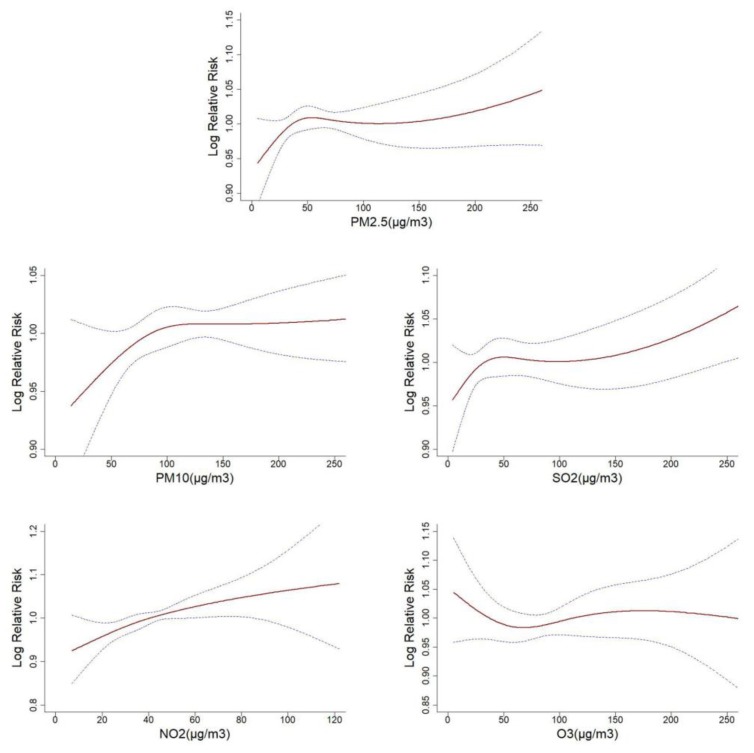
Figure 2.
Exposure-response relationships between five air pollutants and respiratory disease hospitalization (The x-axis represented the concentration of air pollutants (μg/m3) at the current day, the Y-axis indicated Log relative risk of respiratory disease hospitalization. The blue imaginary lines were the 95% CI. All models were adjusted for time, temperature, relative humidity, weekend and public holiday.).

