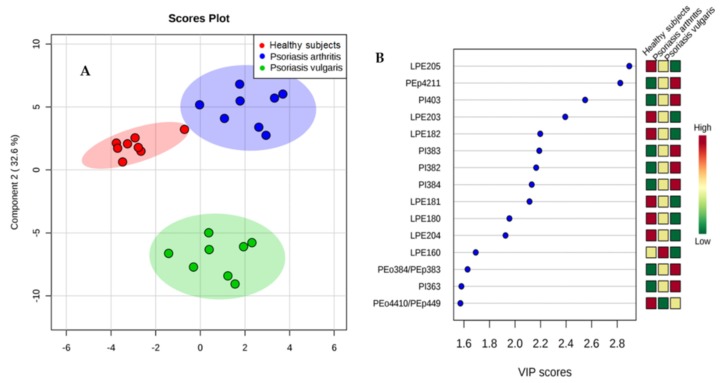
Figure 2.
(A) Partial least squares-discriminate analysis (PLS-DA) plot of the phospholipid species and relative abundance determined by HILIC-LC-MS in the plasma of healthy people and both groups of psoriatic patients. The red triangles indicate healthy subjects (n = 34) while the green and blue crosses represent patients with psoriasis vulgaris (n = 68) and psoriatic arthritis (n = 34), respectively. (B) Graphical presentation of the regulation of phospholipids with VIP score ≥1, which differentiate healthy subjects and patients with psoriasis vulgaris and psoriatic arthritis.

