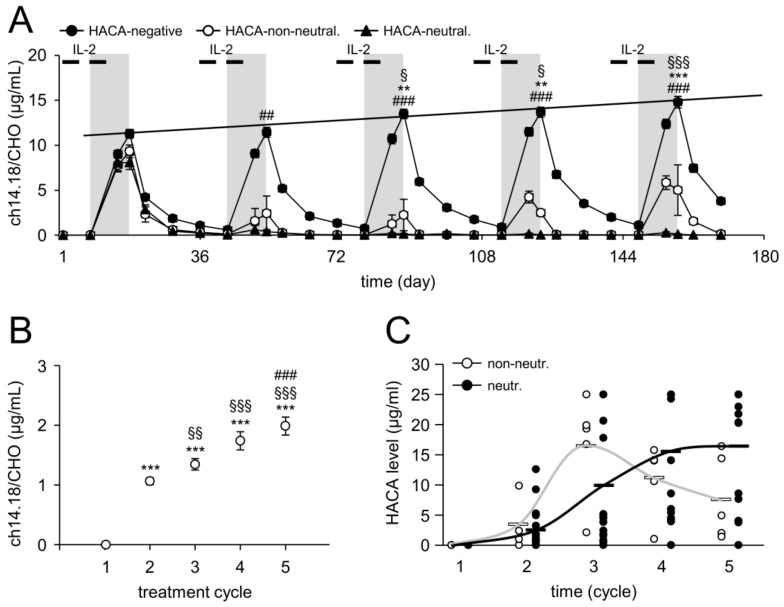
Figure 3.
Serum levels of ch14.18/CHO and HACA in treated pts. (A) Samples collected from HACA-negative (99/122 pts, closed circles) and HACA-positive pts who developed non-neutralizing (5/23 pts, open circles) and neutralizing anti-ch14.18/CHO Ab (18/23 pts, closed triangles) were evaluated with the ch14.18/CHO-triple-ELISA strategy described in “Materials and Methods”. Ch14.18/CHO levels were analyzed prior to start, during and after the end of Ab infusion. The LTI of ch14.18/CHO is indicated by the gray field and IL-2 treatments by the black bars; (B) Baseline ch14.18/CHO concentrations in samples of HACA negative pts collected at d1 of every cycle. Data are shown as mean values ± SEM of experiments performed at least in triplicate. When error bars are not visible they are covered by the symbol. Solid line indicates the trend increase of maximum concentrations of ch14.18/CHO over time; (C) HACA serum levels of each HACA-positive pt of the non-neutralizing (5/23 pts, open circles) and neutralizing (18/23 pts, closed circles) cohort. White (non-neutralizing) and black solid horizontal bars (neutralizing) indicate mean values of the respective group. Grey and black solid lines indicate a trend of HACA levels during the entire treatment period in non-neutralizing and neutralizing pts, respectively. t-test or Mann-Whitney Rank Sum test. (A) ** p < 0.01 vs. d18, cycle 1; *** p < 0.001 vs. d18, cycle 1; § p < 0.05 vs. d18, cycle 2; §§§ p < 0.001 vs. d18, cycle 2; ## p < 0.01 vs. d18, cycle 2 of non-neutralizing pts; ### p < 0.001 vs. d18 of the respective cycle of non-neutralizing pts; (B) *** p < 0.001 vs. d1, cycle 1; §§ p < 0.01 vs. d1, cycle 2; §§§ p < 0.001 vs. d1, cycle 2; ### p < 0.001 vs. d1, cycle 3.

