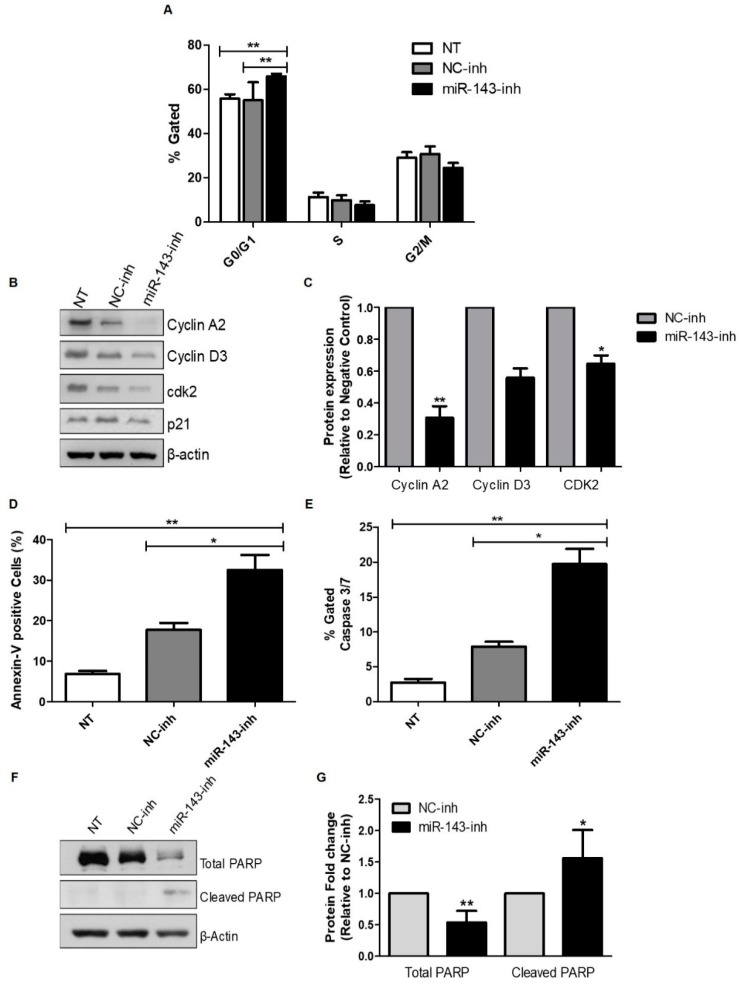
Figure 3.
Inhibition of miR-143 induces apoptosis and cell cycle arrest. Apoptosis and cell cycle progression were measured by flow cytometry as described in the “Materials and Methods” section. U87 cells were transfected with 100 nM of negative control (NC-inh) or miR-143 inhibitor (miR-143-inh). (A) Seventy-two hours later, cells were fixed and cell cycle progression was assessed using the Muse Cell Analyzer. (B) Western blot analysis was performed 72 h after miR-inh transfection to detect changes in cell cycle-related proteins. (C) Densitometric analysis of the band intensities from (B) was performed and intensity values were expressed relative to NC-inh treated cells. U87 cells were treated as in (A), and 72 h later the Muse Cell Analyzer was used to measure apoptosis with (D) Annexin V and (E) Caspase 3/7 activity assays. (F) U87 cells were treated as in (A) and western blot analysis was performed to detect PARP-1 expression. (G) Densitometric analysis of the band intensities from (F) was performed and values were expressed relative to NC-inh treated cells. Columns represent the means of at least triplicates ± SEM (* p < 0.05, ** p < 0.01).

