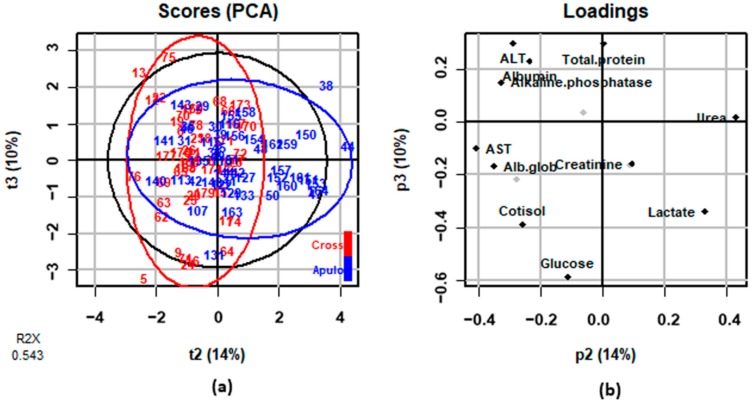
Figure 1.
Results of principal components analysis (PCA) on the variations of blood parameters between T1 and T0: (a) score plots for principal component 2 (t2) and principal component 3 (t3) of Apulo-Calabrese (blue) and crossbreeds (red) samples; (b) loadings plot with the weights of variables included in principal component 2 (p2) and principal component 3 (p3).

