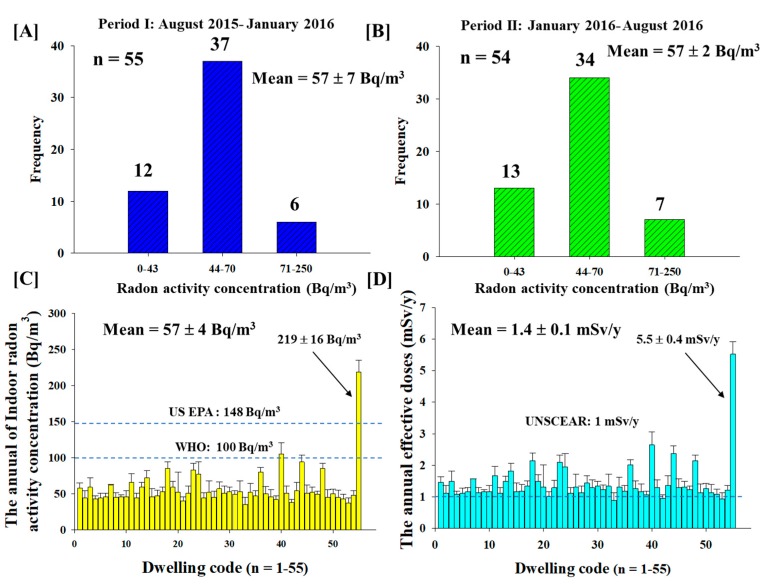
Figure 2.
The radon activity concentrations and the effective doses of inhalation. (A) Distribution of the radon activity concentrations in Chiang Mai from August 2015 to January 2016. (B) Distribution of the radon activity concentrations in Chiang Mai from January to August 2016. (C) One-year average of radon activity concentrations in 55 Chiang Mai dwellings. (D) Annual mean effective dose for inhalation dose in 55 Chiang Mai dwellings.

