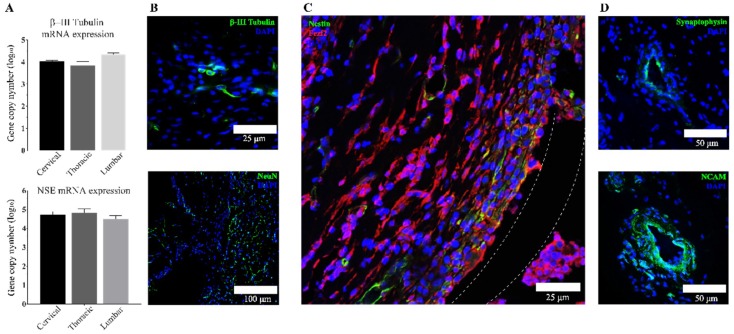
Figure 4.
Neuronal marker expression in aNSCs from 4-week scaffolds. (A) Shows qPCR absolute quantification data of β-III tubulin and NSE genes reported as log10 the number of gene copies in 100 ng total RNA. No significant difference was found in β-III tubulin and NSE expression in different regions by ANOVA (p < 0.05). Data reported as mean ± SEM with n = 3. (B) Shows representative images of IHC staining of β-III tubulin along with the mature neuronal marker, NeuN. (C) Shows co-staining of corticospinal tract specific marker, FezF2, along with nestin. Dotted lines represent the edges of the chitosan tube that surrounded the bioscaffold. (D) shows representative images of IHC staining of synaptophysin; a neuronal vesicles marker, and NCAM; a binding glycoprotein expressed on the surface of neurons and glial cells.

