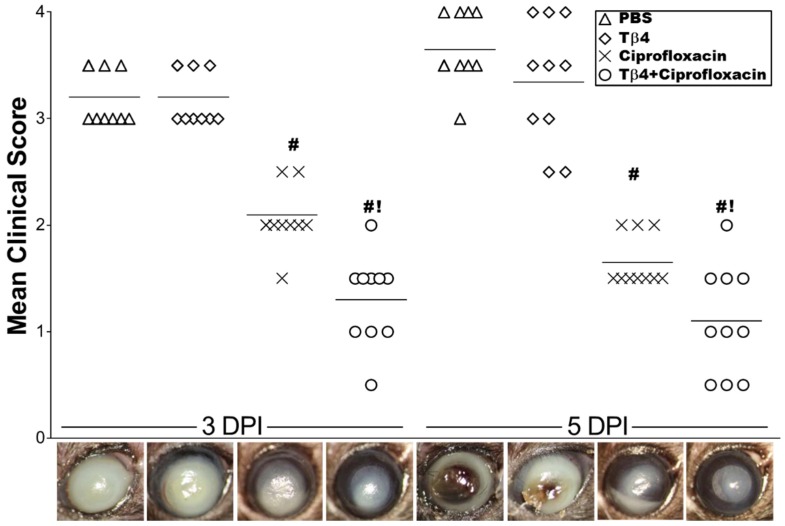
Figure 1.
Ocular disease response of P. aeruginosa-infected B6 mice. Corneal response was graded at 3 & 5 days p.i. (N = 10 mice/group). Results are represented as mean clinical scores ± SEM. Photographs taken by slit-lamp provide further visualization of the differences in clinical scores between the different treatment groups and include: PBS (∆), Tβ4 (◊), ciprofloxacin (×), and Tβ4 + ciprofloxacin (○). # P < 0.05 versus PBS; ! P < 0.05 versus ciprofloxacin.

