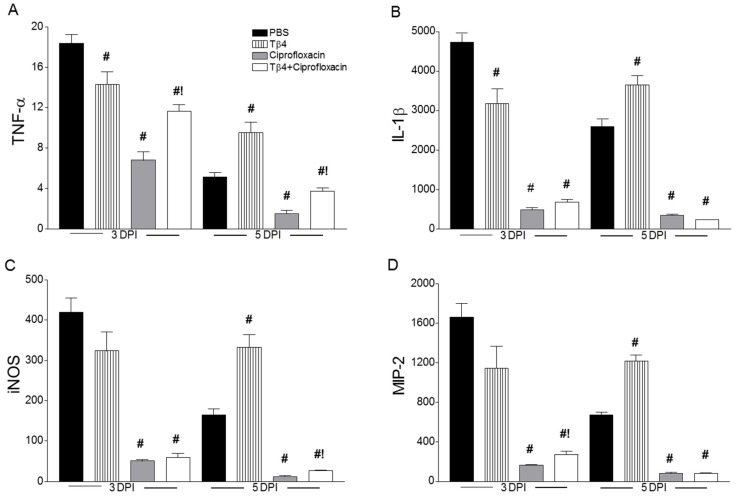
Figure 4.
mRNA levels of select cytokine and chemokines at 3 and 5 days p.i. in corneas of B6 mice after PBS, Tβ4, ciprofloxacin, and Tβ4 + ciprofloxacin treatment. mRNA expression levels for TNF-α (A), IL-1β (B), iNOS (C), and MIP-2 (D) are normalized to β-actin and represented as relative fold change for the gene of interest compared to normal (uninfected) controls ± SEM. N = 8 corneas/group/time point. # P < 0.05 versus PBS; ! P < 0.05 versus ciprofloxacin.

