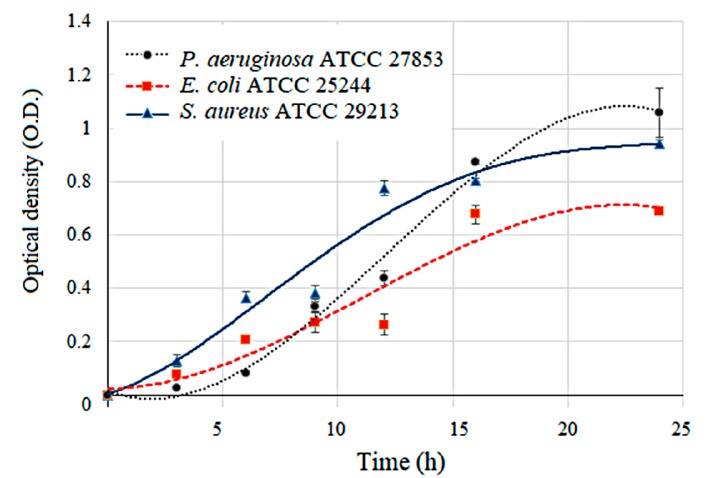
Figure 6.
The optical density at 600 nm (OD600) was plotted versus time for individual pathogens in culture over an incubation period of 24 h. The growth curves were distinct for each pathogen. Blue triangle, red square, and black circle represent the data points used to construct the growth curves of S. aureus, E. coli, and P. aeruginosa, with R-squared (R2) statistics of 0.9628, 0.9214 and 0.9881, respectively.

