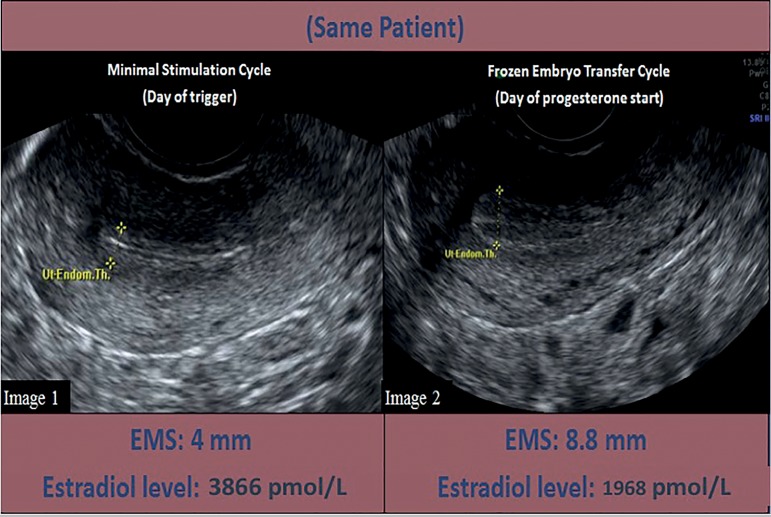
Figure 6.
Endometrial thickness comparison in the same patient who underwent minimal stimulation IVF and frozen embryo transfer Image 1: Sonographic image of a patient’s endometrial lining on the trigger day of her minimal stimulation cycle. Her endometrial lining measures 4 mm and her estradiol level is 3866 pmol/L. Image 2: Sonographic image of the same patient’s endometrial lining on the day of progesterone start during her subsequent frozen embryo transfer cycle. Her endometrial lining measures 8.8 mm and has a trilaminar appearance. Her estradiol level is 1968 pmol/L.

