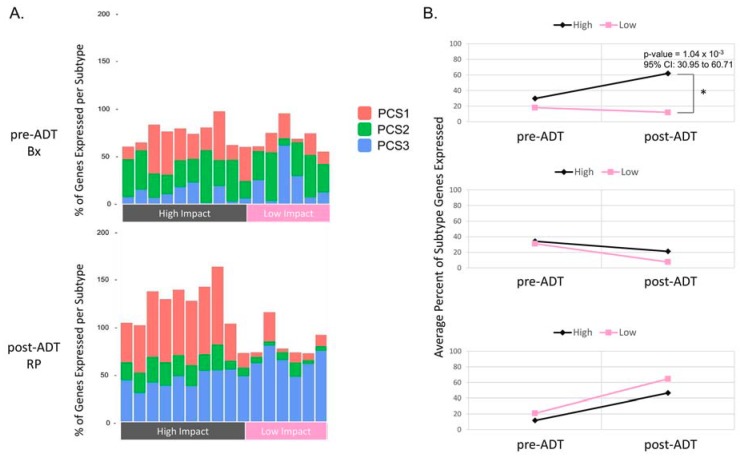
Figure 2.
Divergent expression of the PCS1 genes in the high impact group and common loss of PCS2 and PCS3 after ADT. (A) The bar plots depict three stacked bars. Each bar displays the fraction of the subtype-specific genes expressed in a given subtype that is more than two-fold above the median across all samples. Both the high and low impact groups lose the expression of the PCS2 genes after ADT, but the high impact group samples display a retention and increase in the PCS1 signature after ADT, while the low impact group loses the PCS1 signature but displays an increase in the PCS2 gene expression; (B) Plots depict the average percent change of the subtype gene expression before and after ADT. The PCS1 gene signature is significantly higher in the high impact group after ADT than in the low impact group after ADT (p-value = 1.04 × 10⁻³ 95% CI: 30.95 to 60.71 by Mann–Whitney test).

