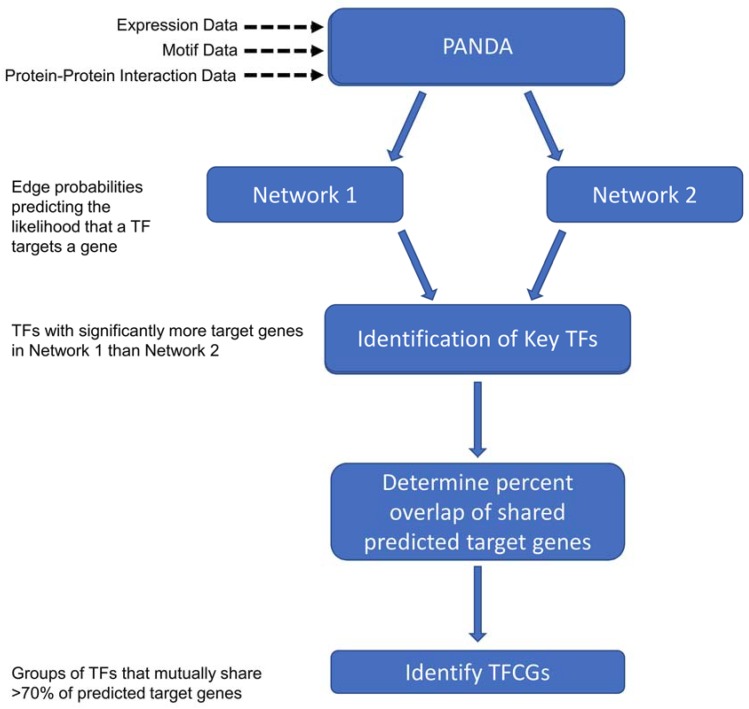
Figure 3.
A flowchart depicting the how transcription factor coordinated groups (TFCGs) were identified. Expression-, motif-, and protein interaction data were used as inputs to PANDA. This was run twice using two independent expression datasets (e.g., high- and low impact expression data) to generate networks. Post-processing of the PANDA output (refer to methods) yielded edge probabilities representing the likelihood that a transcription factor targets a given gene. Next, Key TFs were found based on the criteria that a TF gains a significant number of predicted target genes in one network versus another. After determining the percentage overlap of shared predicted target genes (refer to methods), TFCGs were ascertained as groups of Key TFs that share >70% of the predicted target genes.

