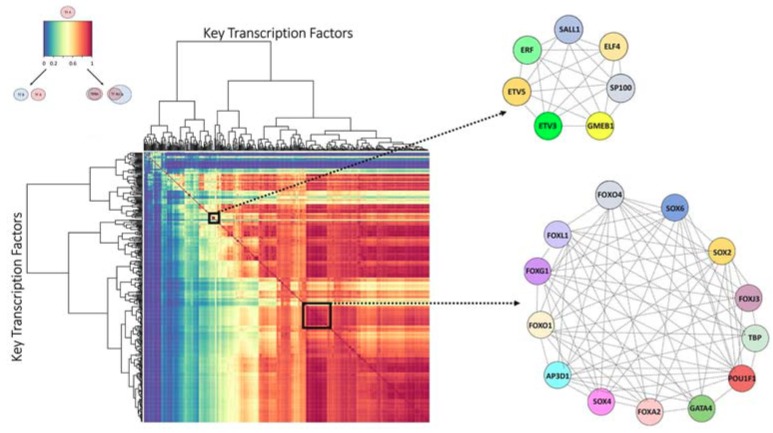
Figure 4.
The identification of TFCGs in the high impact group network. The heatmap displays the hierarchical clustering of putative gene target percentage overlap of one Key TF as compared to all others. The dark blue to dark red color gradient denotes the degree of shared target overlap. Because the degree of target overlap between a pair of Key TFs may be non-reciprocal, the dendrograms are ordered based on mutual relationships and are oriented identically on the x- and y-axis. The diagonal represents a Key TF compared to itself. Only reciprocal relationships between groups of Key TFs were considered TFCGs (white boxes demarcate two representative TFCGs as symmetrical squares on the diagonal). Beside the heatmap are two representative TFCG schematics depicting a TFCG containing Key TFs that reciprocally share >70% of their predicted target genes with each other.

