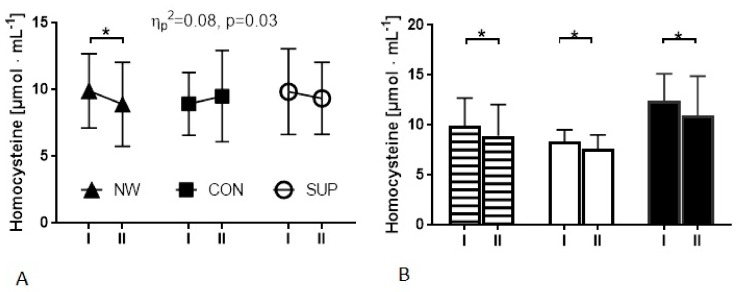
Figure 3.
Changes in the resting homocysteine concentration in groups induced by the applied procedure. (A) I—at baseline, II—after 12weeks in NW, control and supplemented groups. (B) Analysis only in the NW Group; marked columns—all participants from the NW group, white columns—participants from the NW group with a baseline homocysteine ≤10 µmol·L−1, black columns—participants from the NW group with a baseline homocysteine >10 µmol·L−1, I—at baseline, II—after 12cweeks of NW training.

