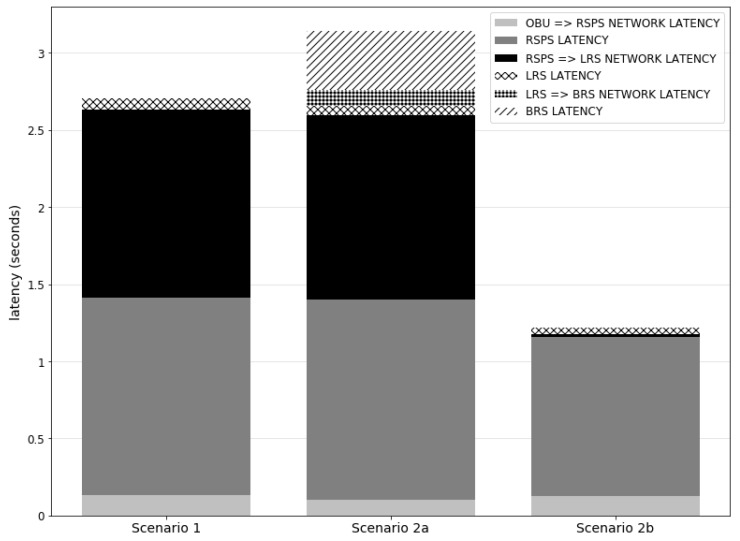
Figure 8.
Bar plot showing the average total system latency of three types of observations, over all scenario runs: the observation in scenario 1 causing a WarnNurseAction handled locally, the observation in scenario 2a leading to a CallNurseAction handled by the back-end, and another observation in scenario 2b that causes the creation of another WarnNurseAction. For each situation, the different network and component latencies that sum up to the total system latency are indicated by the stacked bars.

