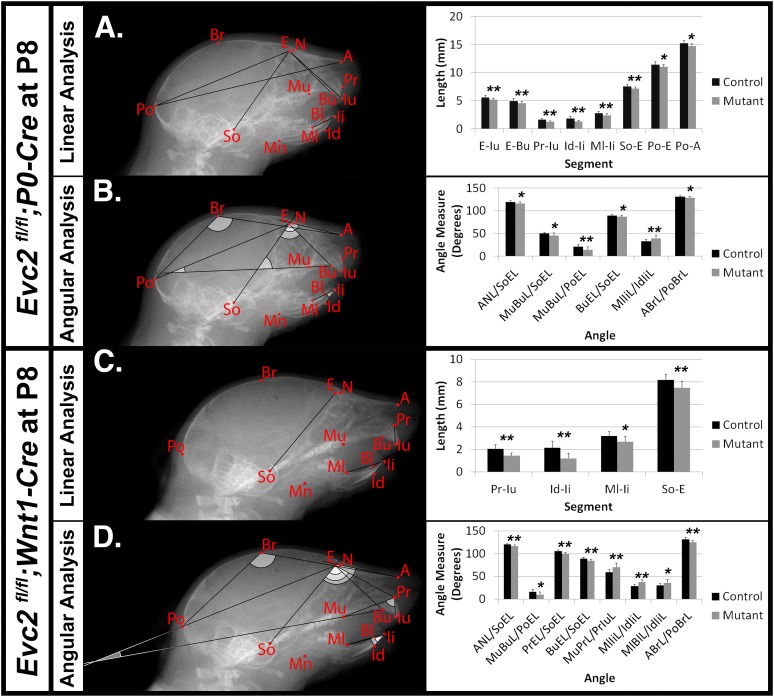
FIGURE 2.
Differential mid-facial defects between Evc2 P0 mutants and Evc2 Wnt1 mutants at P8. Lateral X-ray cephalogram indicates the linear (A) and angular (B) measurements with significant differences between controls and Evc2 P0 mutants. Lateral X-ray cephalogram indicates the linear (C) and angular (D) measurements with significant differences between controls and Evc2 Wnt1 mutants. Graphs indicate the linear and angular values of the measurement with significant differences (N = 7; ∗p < 0.05; and ∗∗p < 0.01).

