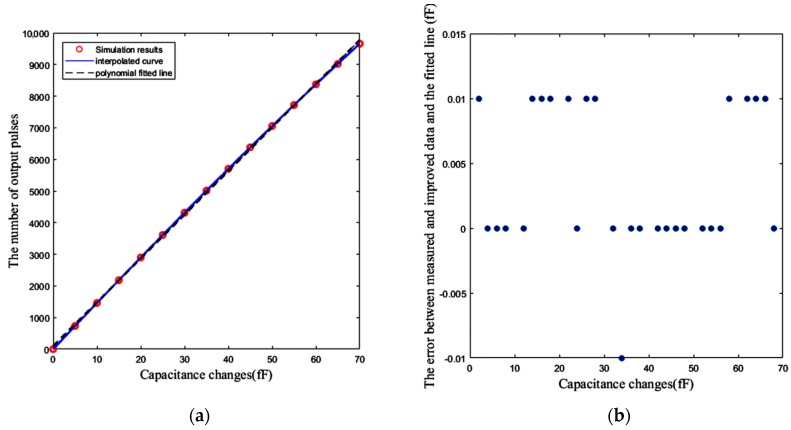
Figure 20.
(a) Fifteen measured number of pulses versus capacitance changes ΔC (fF) at 27 °C, and the interpolated curve and the polynomial fitted line to these 15 points. (b) The error between the measured numbers of pulses related to the other values of ΔC after pre-distortion, and the polynomial fitted line.

