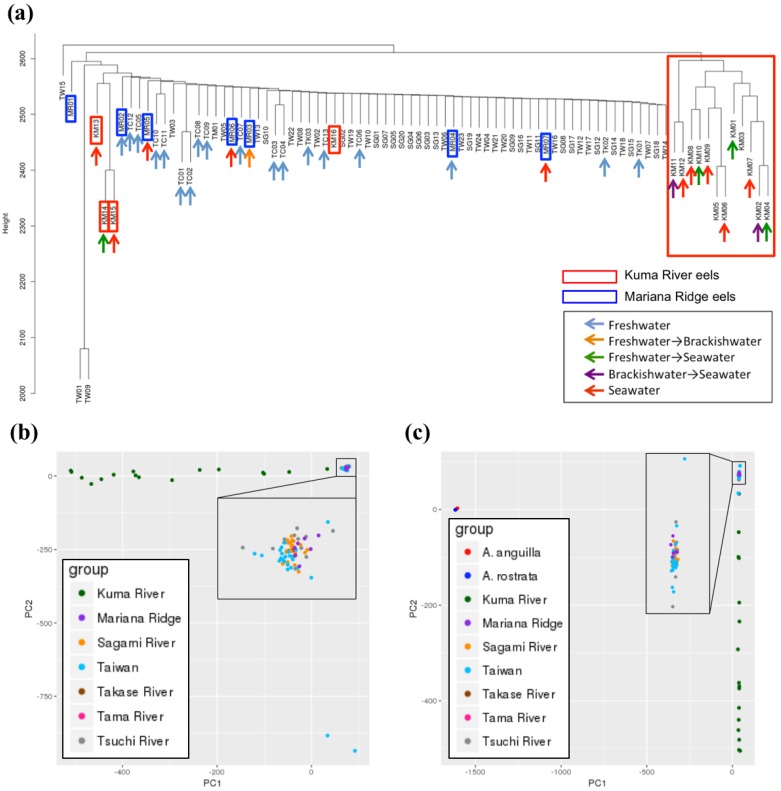
Figure 2.
Genetic population analysis of 84 Japanese eel (Anguilla japonica) individuals based on 32,312,607 single nucleotide polymorphism (SNP) sites. (a) Cluster analysis showed that every sample except KM01–KM12 formed a larger cluster, whereas the 12 KM samples formed a separate smaller cluster; (b) Principal component analyses (PCA) of the samples collected in various areas. The Kuma River samples (KM01–KM16) were scattered along the horizontal axis PC1. Therefore, they are distinct from the other populations; (c) PCA with the European and American eels. The Japanese eel and the other eels (European eel: A. anguilla; American eel: A. rostrata) were segregated on the PC1 axis. The Kuma River samples were scattered along the horizontal axis PC2.

