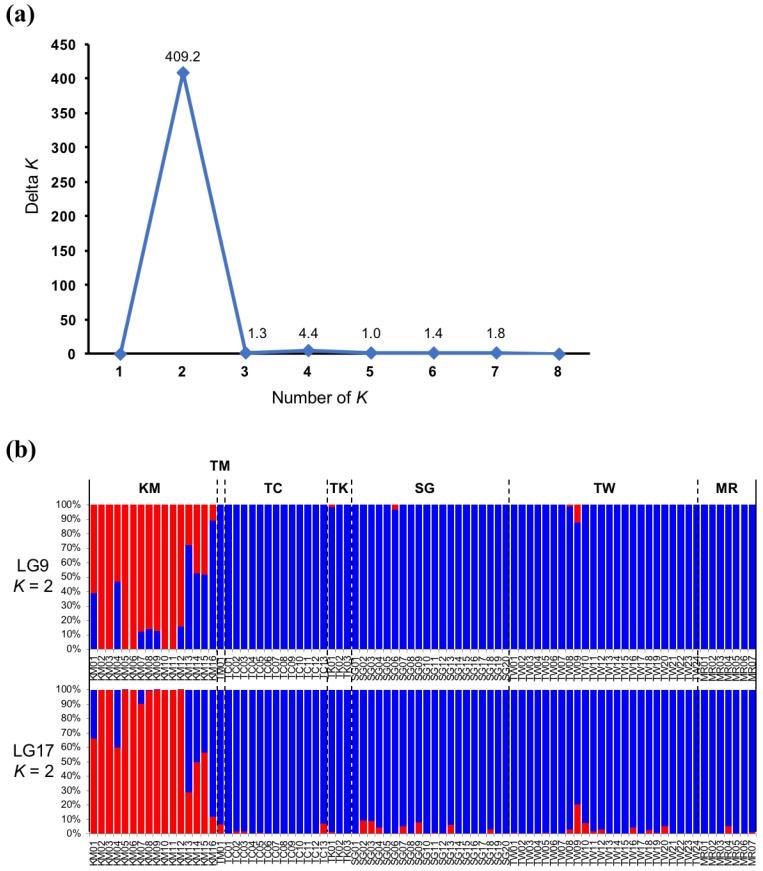
Figure 3.
Elucidation of the Japanese eel (Anguilla japonica) population structure in STRUCTURE [41]. (a) The linkage group (LG) 17 (13,825 SNPs) dataset showed a single peak at K = 2. Therefore, these individuals are from two genetically distinct populations; (b) Population structure of the Japanese eel based on the SNP sites at LG9 and LG17. Each vertical bar color (red and blue) represents an ancestral population. K = 2 was used for analysis; K is the number of populations assumed.

