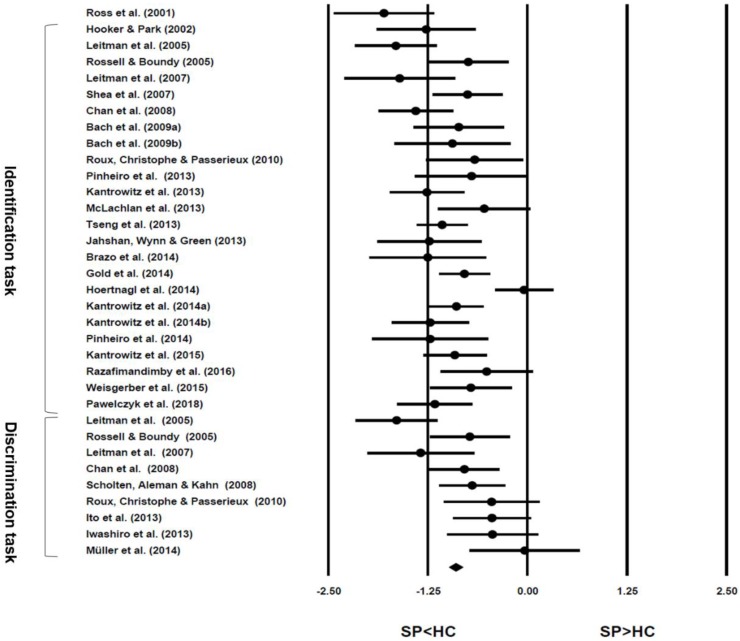
Figure 3.
Forest plot with effect size (d) and confidence intervals for the selected studies. Note: Ross et al.’s study (2001) only reported the results of comprehension tasks, thus excluded from the meta-analysis of both identification and discrimination paradigm but included in the overall effect size calculation.

