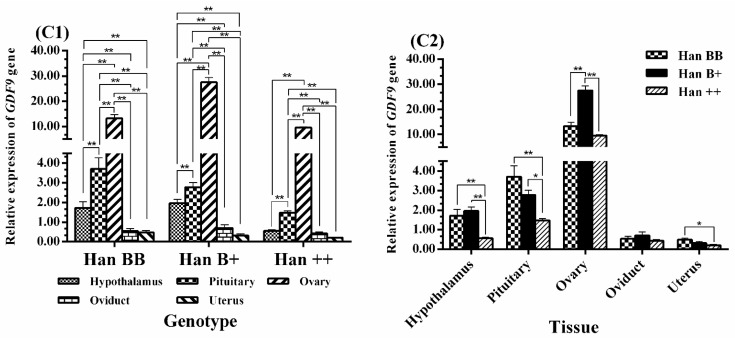
Figure 5.
Comparison of expression of GDF9 among three FecB genotypes (C1) and among tissues (C2). Means with different superscripts are significantly different. The significant results with a p-value lower than 0.01, 0.05 are giving two asterisks (**) and one asterisk (*), respectively. Nonsignificant results are not giving any asterisks.

