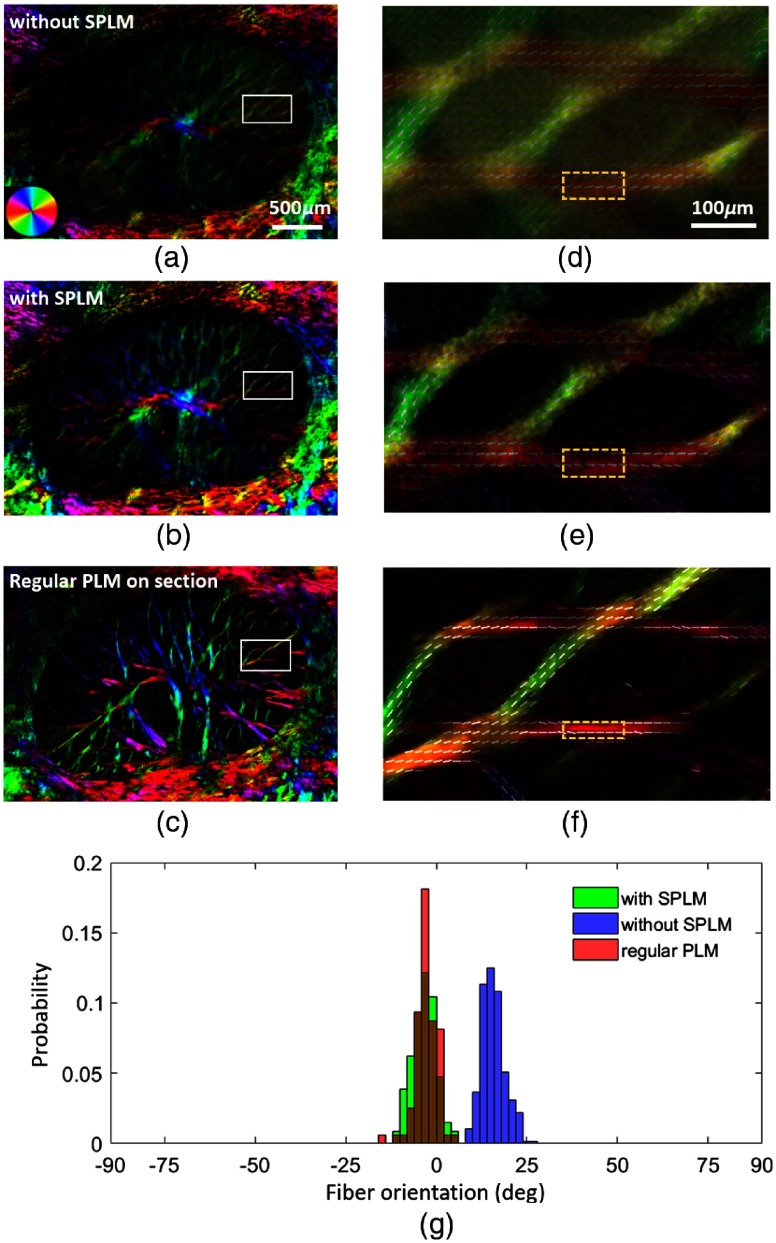
Fig. 5.
The panels show fiber orientation maps of thick fresh sheep ONH obtained (a and d) without SPLM, (b and e) with SPLM, (c and f) of a -thick section obtained using regular PLM, and the histograms of fiber orientations of the three ROIs indicated with yellow boxes in (d), (e), and (f). The colors in the fiber orientation images correspond to the fiber orientation as per the legend shown in the bottom-left of (a). The left-side column shows full views of the lamina cribrosa, whereas the right-side column shows close-ups of the ROIs indicated with the white boxes on the left-hand-side images. In addition to the good contrast, orientations derived from SPLM show excellent agreement with those from PLM. Orientations obtained without SPLM deviated by about 20°.

