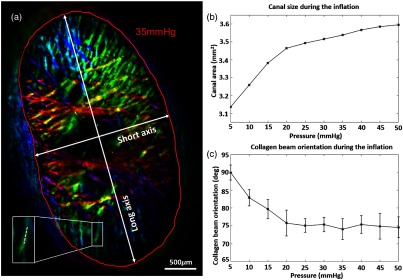
Fig. 7.
(a) Fiber orientation map of a fresh pig ONH at 35 mmHg intraocular pressure. Double-arrows indicate short and long axes of the scleral canal. The red line indicates the manual segmentation of the scleral canal, enclosing the lamina cribrosa. (b) Canal size as a function of inflation pressure. (c) Collagen beam orientation as a function of inflation pressure. The collagen beam was indicated with a white box in (a). The error bar indicates the standard deviation of fiber orientation. The inset shows the close-up image of the collagen beam and the mean and standard deviation of the fiber orientation were calculated along the dotted-line.

