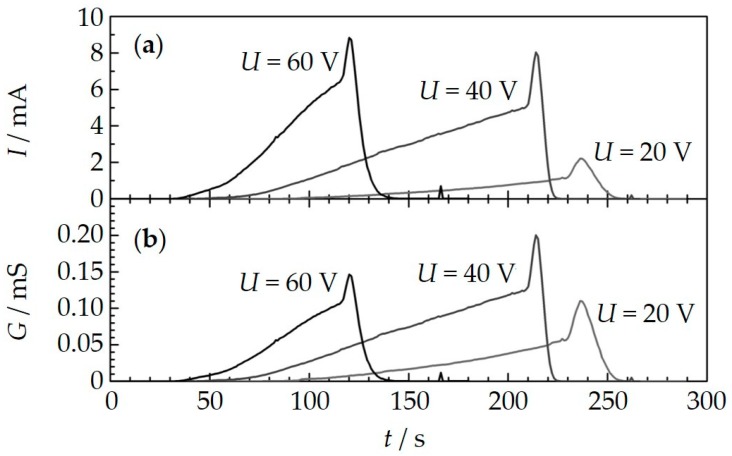
Figure 4.
Raw data I(t) ((a) and calculated conductance data G (b) for three measurement cycles (soot collection with different voltages and subsequent regeneration) under similar conditions (soot concentration = 17 mg/m3). The curves are shifted to a common starting time that is the end of the prior regeneration phase.

