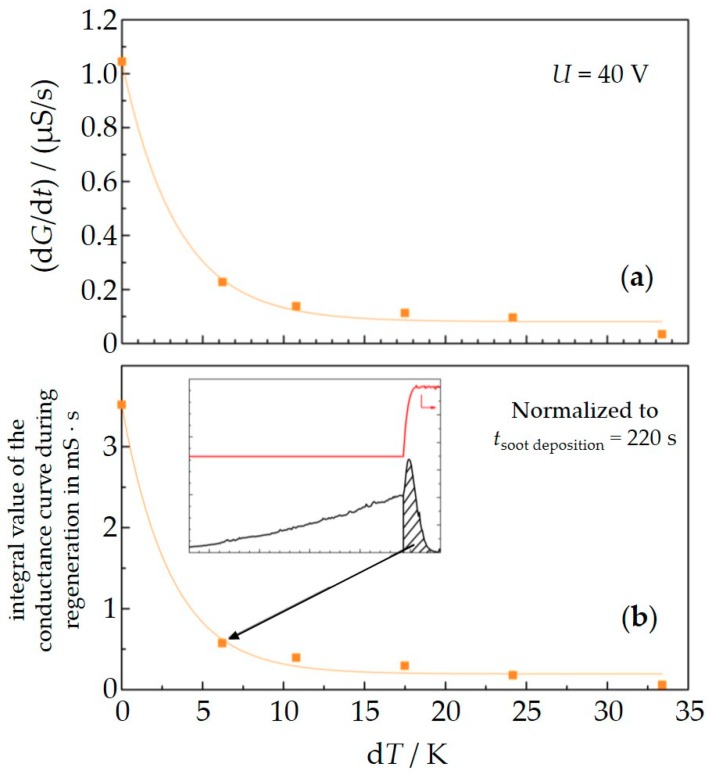
Figure 9.
Slope of the conductance dG/dt (evaluated from the data in Figure 8) vs. temperature difference between sensor and exhaust gas dT (a). The normalized integral values of the conductance curve during regeneration show similar behavior (b). The inset shows the calculation for the integral value exemplarily.

