Fig. 5.
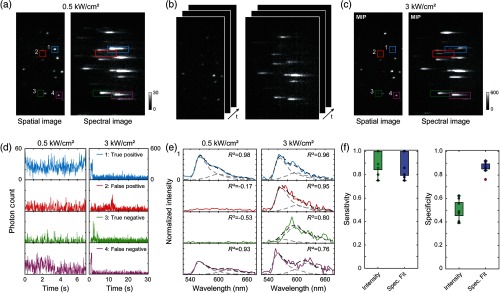
Identifying fluorescent impurities in SMLM. (a) Average spatial and spectral image of DNA origami nanorulers, containing two emitting points labeled with single Alexa Fluor 532 and Alexa Fluor 568 molecules 10 nm apart, immobilized on a poly-L-lysine coated surface. Images were acquired under illuminations with power densities associated with conventional fluorescence imaging (). (b) Stack of 1500 frames of the spatial and spectral images of the nanoruler sample for sSMLM () using the same FOV. (c) MIP images of the spatial and spectral of the same FOV. (d) Photon count versus time from two selected nanorulers (1, 4) and two selected fluorescent impurities (2, 3) highlighted in average and MIP of sSMLM images. (e) Corresponding spectra of the point sources identified in the average and sSMLM images representing true positive, false positive, true negative, and false negative cases for the spectral fitting method. (f) Sensitivity and (g) specificity comparison for nine datasets using an emission intensity threshold of 180 and a spectral fitting filter adjusted threshold of 0.84.

