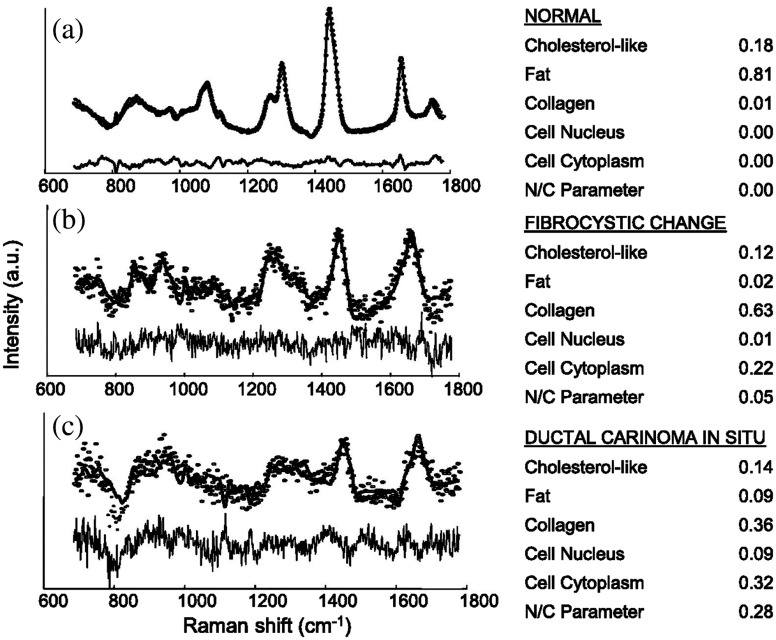
Fig. 11.
Raman spectra and fit coefficients for (a) normal breast tissue, (b) fibrocystic change, and (c) DCIS.111 The use of Raman has progressed to mapping, but the low-signal levels have limited to point sampling largely from imaging, and so the major barrier in this area has been the logistics of application in a time efficient manner to large specimens. But the attraction to having native molecular specific information about the tissue has always been a driving factor in utilizing this methodology for true molecular specific detection of disease. Adapted with permission from Ref. 111, AACR.

