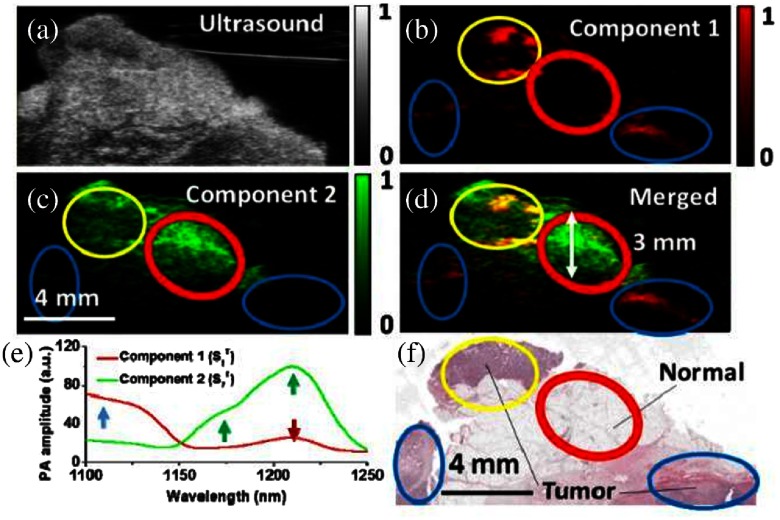
Fig. 5.
Example of photoacoustic images of a breast specimen: (a) ultrasound image of the specimen, (b) component 1 shows hemoglobin contrast, (c) component 2 shows adipose contrast, (d) combined Component 1 and component 2 image, (e) spectra of these components, and (f) H&E image corresponding to the regions of interest.86 This type of imaging shows some potential for deep tissue information albeit at lower spatial resolution than microCT or MRI and tends to have most ex vivo contrast based upon fat and water concentrations. Specificity for cellular or molecular features is uncertain at this time. Adapted with permission from Ref. 86, OSA Publishing.

