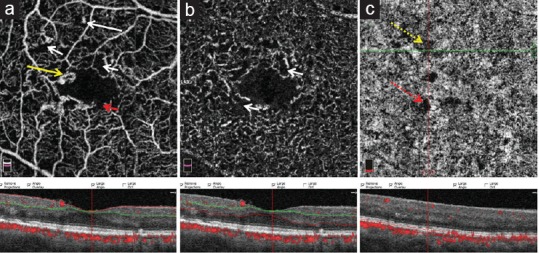
Figure 2.

Optical coherence tomography images from the superficial capillary plexus (a), deep capillary plexus (b), and choriocapillaris (c) slabs with corresponding structural optical coherence tomography images in a patient with diabetic retinopathy. The figure shows microaneurysm (white long arrow), capillary non-perfusion (white short arrow), enlarged foveal avascular zone with a notch (red short arrow), focal microvascular tortuosity and dilation (yellow arrow), focal areas of true signal impairment (yellow dotted arrow) and shadow artifact (red dotted arrow).
