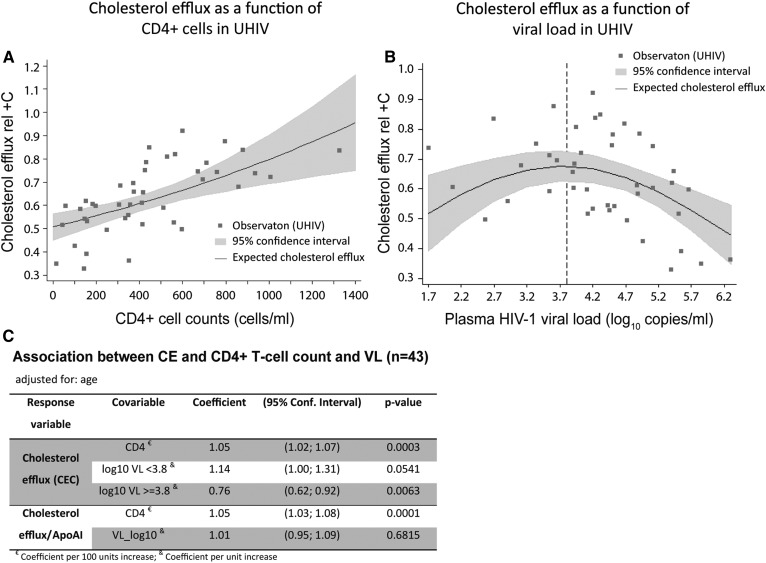
Fig. 2.
Statistical models of CE and CE/ApoAI in UHIVs (n = 43) adjusted for age. A: Scatterplot and linear regression model of the expected CE level with a 95% CI as a function of CD4+ T-cell counts. B: Scatterplot and regression model of the mean of CE with a 95% CI as a function of plasma HIV-1 VL. The regression model has the shape of a convex parabola and the dashed line indicates the position of the knot (approximately the vertex) used in the piecewise analysis. C: Piecewise regression models of CE and linear regression models of CE relative to ApoAI (CE/ApoAI) evaluated against VL and CD4+ T-cell counts. Only multivariate models are shown.

