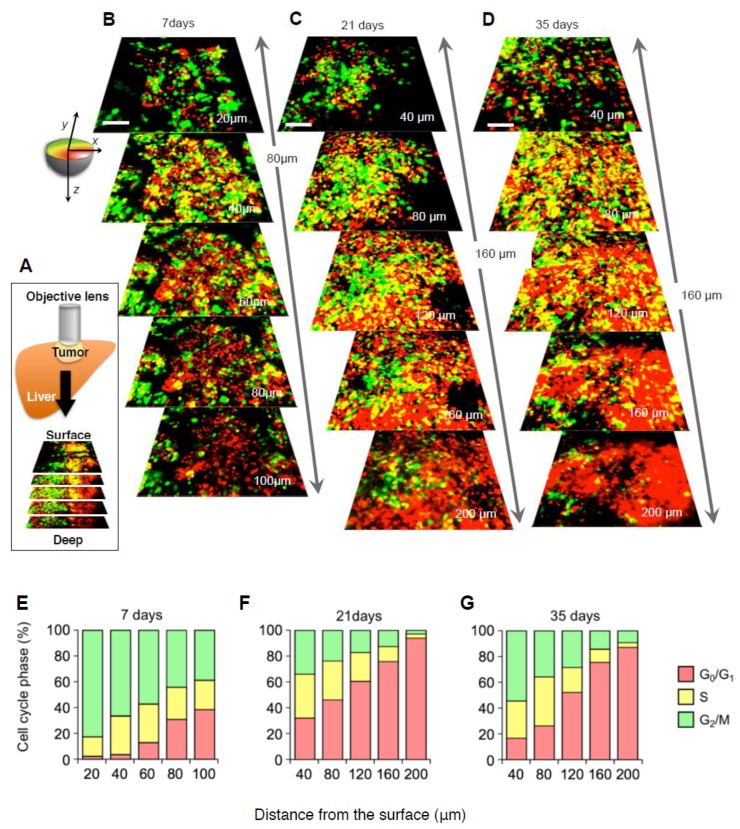
Figure 2.
Intravital cell cycle imaging in FUCCI-expressing tumors shows the cell-cycle phase distribution of cancer cells at the tumor surface and center. High-resolution images (tile scan) were obtained with a 20 × (0.95 numerical aperture immersion) objective lens. To monitor the cell-cycle distribution of cancer cells during tumor growth, three-dimensional images (z stacks) of the same tumor at day 7, 28, and 90 post-implantation were used. (A) The schematic diagram shows the method of longitudinal intravital CLSM imaging of FUCCI-expressing MKN45 gastric-cancer cells growing in the liver using a skin-flap window. (B–D) FUCCI-expressing MKN45 cells were implanted directly in the liver of nude mice and imaged at 7 days (B), 21 days (C), and 35 days (D). (E–G) Histograms show the distribution of FUCCI-expressing cells at different distances from the surface. The number of cells in each cell-cycle phase was assessed by counting the number of cells of each color at the indicated time points and depth. The percentage of cells in the G2/M, S, and G0/G1 phases of the cell cycle are shown. Scale bars represent 100 μm. Data are means ± SD. (Reproduced from [46] with the permission of Taylor and Francis).

