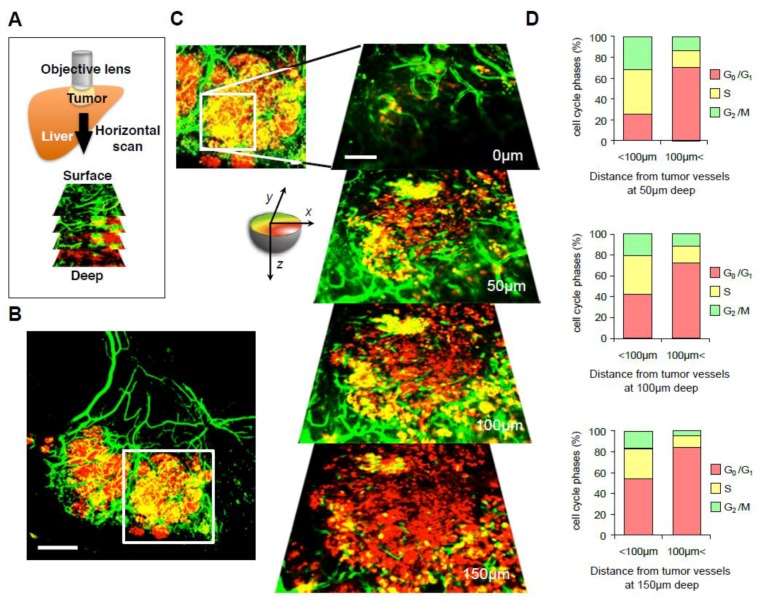
Figure 4.
Imaging nascent tumor vessels and cancer cell-cycle phase. (A) The schematic diagram shows the method of repeated intravital CLSM imaging of FUCCI-expressing cells growing in nestin-driven green fluorescent protein (ND-GFP)-expressing transgenic nude mice in which tumor nascent vessels express GFP. (B) Representative whole image of orthotopic FUCCI-expressing tumor in ND-GFP-expressing nude mice. (C) Representative images of FUCCI-expressing cancer cells at various depths in a tumor in the liver at 28 days after implantation are shown. (D) Histogram shows the cell cycle phase distribution at different distances (xy-plane) from blood vessels. Scale bars represent 100 μm. (Reproduced from [46] with the permission of Taylor and Francis).

